Trends & analytics
Dashboard widgets show revenue, active passes, course utilisation and churn as trends over time, with year-on-year comparison.
Overview
The dashboard widgets show trends over time: revenue (day/week/month with previous-period comparison), active passes and memberships over 12 months, course utilisation (once check-ins/check-outs are recorded) and deactivated accounts of the last 6 months as a churn signal. Each widget can be opened individually, filtered and pinned to the dashboard. This keeps the key figures of your organisation in view at all times.
Example: revenue
Under Analytics → Revenue you open the revenue trend with year-on-year comparison:
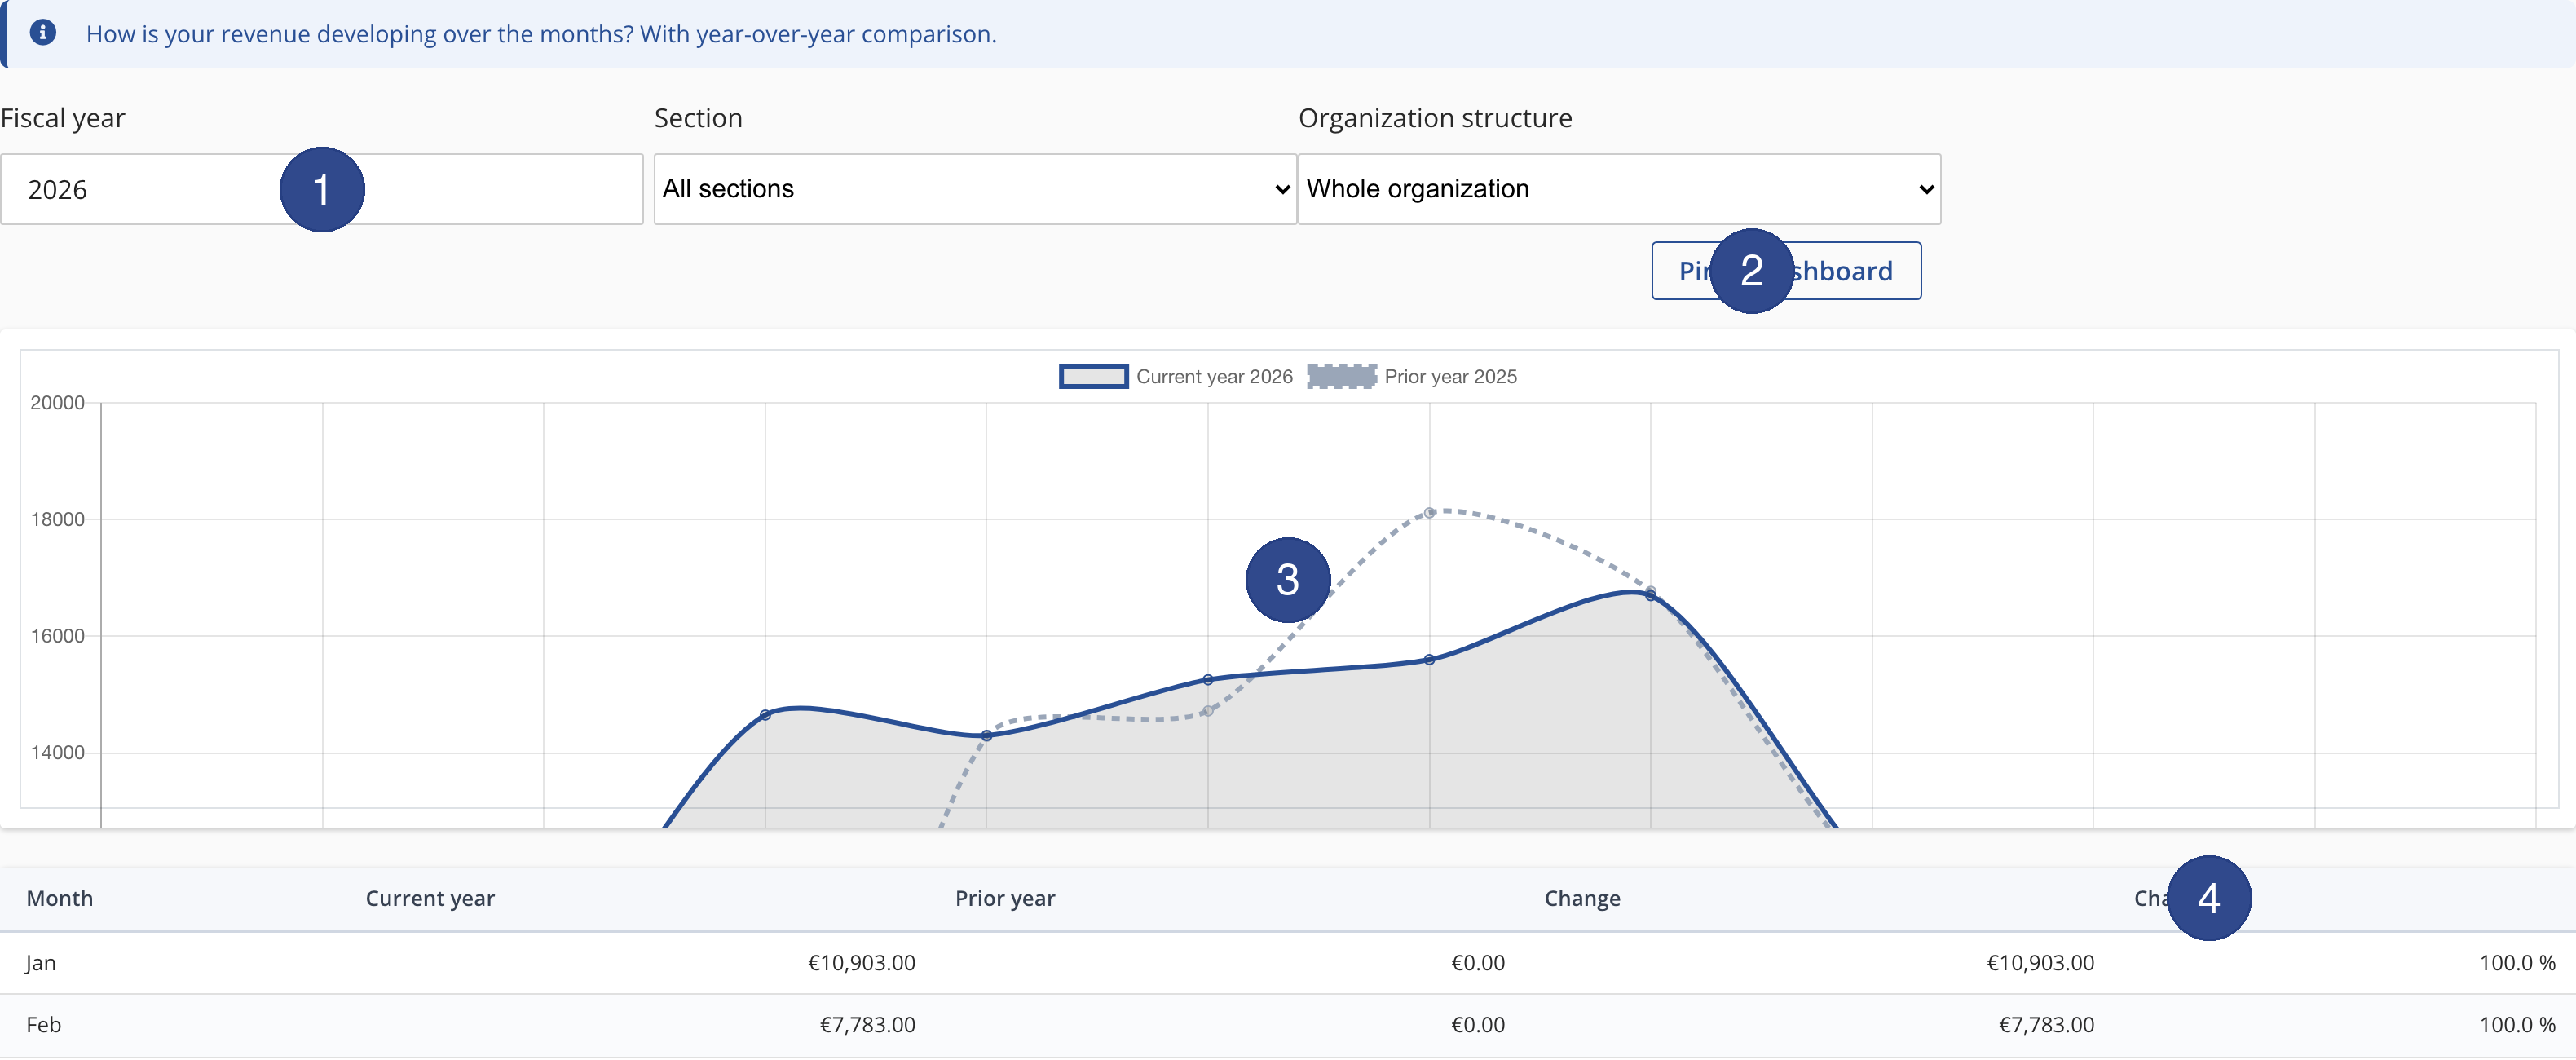
This lets you see at a glance whether revenue is above the previous year, and compare individual months or sections in a targeted way. The organisation structure filter is especially useful for umbrella bodies that view several tenants consolidated.
More trends
Besides revenue, further trends are available: active passes and memberships over the last 12 months show the growth of your member base; course utilisation is fed from the recorded attendances and shows how well courses are attended; the deactivated accounts of the last 6 months serve as an early churn signal so you can take action before too many members leave. All trends update automatically as new bookings, registrations or check-ins come in. A click on Pin to dashboard keeps the chosen trend permanently on the start page.